

QUESTION NO: 1
Note: This question is a part of a series of questions that present the same scenario. Each question in the series contains a unique solution that might meet the stated goals. Some question sets might have more than one correct solution, while others might not have a correct solution.
After you answer a question in this section, you will NOT be able to return to it. As a result, these questions will not appear in the review screen.
You have a query for a table named Sales. Sales has a column named CustomerID. The Data type of CustomerID is Whole Number.
You refresh the data and find several errors. You discover that new entries in the Sales table contain nonnumeric values.
You need to ensure that nonnumeric values in the CustomerID column are set to 0.
Solution: From Query Editor, select the CustomerID column and click Replace Errors.
Does this meet the goal?
Note: This question is a part of a series of questions that present the same scenario. Each question in the series contains a unique solution that might meet the stated goals. Some question sets might have more than one correct solution, while others might not have a correct solution.
After you answer a question in this section, you will NOT be able to return to it. As a result, these questions will not appear in the review screen.
You have a query for a table named Sales. Sales has a column named CustomerID. The Data type of CustomerID is Whole Number.
You refresh the data and find several errors. You discover that new entries in the Sales table contain nonnumeric values.
You need to ensure that nonnumeric values in the CustomerID column are set to 0.
Solution: From Query Editor, select the CustomerID column and click Replace Errors.
Does this meet the goal?
Correct Answer: B
Vote an answer
Explanation: Only visible for Actual4test members. You can sign-up / login (it's free).
QUESTION NO: 2
You have the following tables.
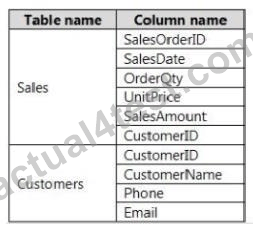
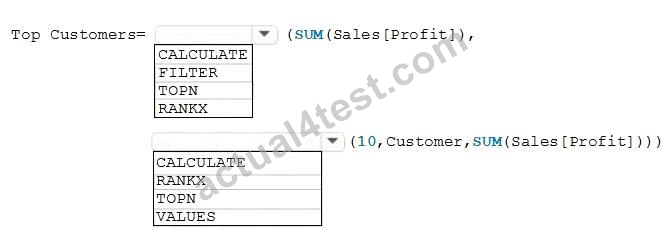
You need to create a new table that displays the top 10 customers by the total of SalesAmount.
How should you complete the DAX formula? To answer, select the appropriate options in the answer area.
NOTE: Each correct selection is worth one point.
You have the following tables.
You need to create a new table that displays the top 10 customers by the total of SalesAmount.
How should you complete the DAX formula? To answer, select the appropriate options in the answer area.
NOTE: Each correct selection is worth one point.
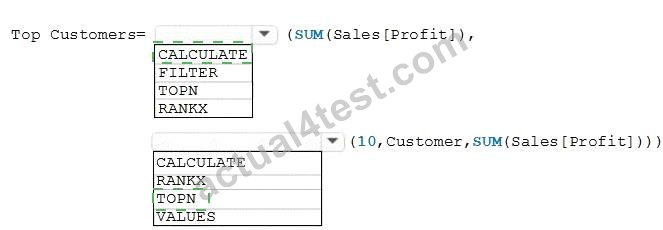
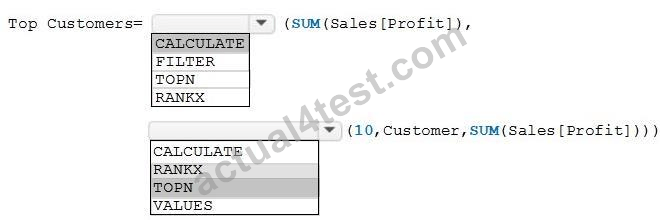
Correct Answer:
QUESTION NO: 3
Your organization has a team of power users who recently created 20 Power BI dashboards.
The power users share the dashboards with other users in the organization.
When the users attempt to access the dashboards, they receive the error message shown in the exhibit. (Click the Exhibit.)
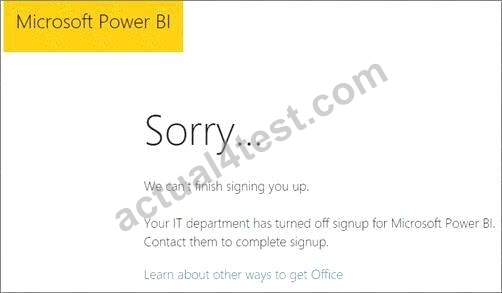
You need to ensure that all the users can access the dashboards.
What should you do first?
Your organization has a team of power users who recently created 20 Power BI dashboards.
The power users share the dashboards with other users in the organization.
When the users attempt to access the dashboards, they receive the error message shown in the exhibit. (Click the Exhibit.)
You need to ensure that all the users can access the dashboards.
What should you do first?
Correct Answer: C
Vote an answer
Explanation: Only visible for Actual4test members. You can sign-up / login (it's free).
QUESTION NO: 4
Note: This question is part of a series of questions that present the same scenario. Each question in the series contains a unique solution that might meet the stated goals. Some question sets might have more than one correct solution, while others might not have a correct solution.
After you answer a question in this section, you will NOT be able to return to it. As a result, these questions will not appear in the review screen.
You have a Microsoft Excel workbook that is saved to Microsoft SharePoint Online. The workbook contains several Power View sheets.
You need to recreate the Power View sheets as reports in the Power Bl service.
Solution: Copy the workbook to Microsoft OneDrive for Business. From Excel, click Publish to Power Bl, and then click Upload Does this meet the goal?
Note: This question is part of a series of questions that present the same scenario. Each question in the series contains a unique solution that might meet the stated goals. Some question sets might have more than one correct solution, while others might not have a correct solution.
After you answer a question in this section, you will NOT be able to return to it. As a result, these questions will not appear in the review screen.
You have a Microsoft Excel workbook that is saved to Microsoft SharePoint Online. The workbook contains several Power View sheets.
You need to recreate the Power View sheets as reports in the Power Bl service.
Solution: Copy the workbook to Microsoft OneDrive for Business. From Excel, click Publish to Power Bl, and then click Upload Does this meet the goal?
Correct Answer: A
Vote an answer
QUESTION NO: 5
You have two Microsoft SQL Server database servers named SQLProd and SQLDev. SQLDev contains the same tables as SQLProd, but only a subset of the data in SQLProd.
You create a new Power BI Desktop model that uses 120 tables from SQLDev.
You plan to publish the Power BI file to the Power BI service.
You need to connect the model to the tables in SQLProd. The solution must minimize administrative effort.
What should you do from Query Editor before you publish the model?
You have two Microsoft SQL Server database servers named SQLProd and SQLDev. SQLDev contains the same tables as SQLProd, but only a subset of the data in SQLProd.
You create a new Power BI Desktop model that uses 120 tables from SQLDev.
You plan to publish the Power BI file to the Power BI service.
You need to connect the model to the tables in SQLProd. The solution must minimize administrative effort.
What should you do from Query Editor before you publish the model?
Correct Answer: A
Vote an answer
Explanation: Only visible for Actual4test members. You can sign-up / login (it's free).
QUESTION NO: 6
You have a query that retrieves data from a Microsoft Azure SQL database.
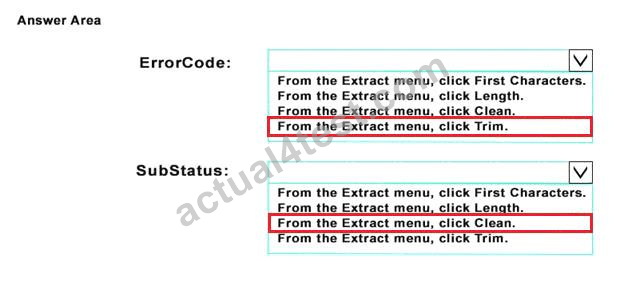
You discover that column named ErrorCode has several values starting with a space character, and a column named SubStatus contains several non-printable characters.
You need to remove all the leading whitespaces from ErrorCode and all the non-printable characters from SubStatus. All other data must be retained.
What should you do on each column? To answer, drag the appropriate tasks to the correct columns. Each task may be used once, more than once, or not at all. You may need to drag the split bar between panes or scroll to view content.
NOTE: Each correct selection is worth one point.
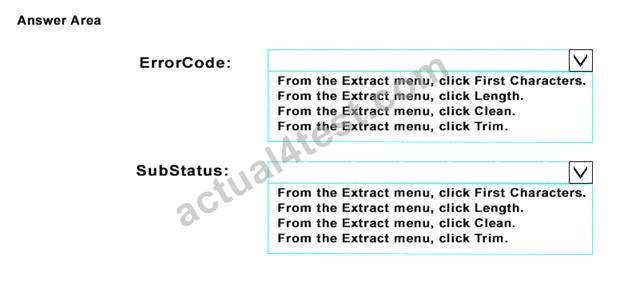
You have a query that retrieves data from a Microsoft Azure SQL database.
You discover that column named ErrorCode has several values starting with a space character, and a column named SubStatus contains several non-printable characters.
You need to remove all the leading whitespaces from ErrorCode and all the non-printable characters from SubStatus. All other data must be retained.
What should you do on each column? To answer, drag the appropriate tasks to the correct columns. Each task may be used once, more than once, or not at all. You may need to drag the split bar between panes or scroll to view content.
NOTE: Each correct selection is worth one point.
Correct Answer:
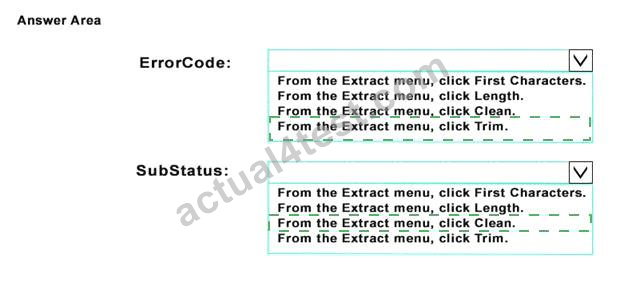
Explanation
References:
https://msdn.microsoft.com/en-us/library/mt260494.aspx
https://msdn.microsoft.com/en-us/library/mt253328.aspx
QUESTION NO: 7
You have a Power BI dashboard that displays different visualizations of company sales.
You enable Q&A on the dashboard.
You need to provide users with sample questions that they can ask when using Q&A.
Which settings should you modify from the Power BI Settings?
You have a Power BI dashboard that displays different visualizations of company sales.
You enable Q&A on the dashboard.
You need to provide users with sample questions that they can ask when using Q&A.
Which settings should you modify from the Power BI Settings?
Correct Answer: B
Vote an answer
Explanation: Only visible for Actual4test members. You can sign-up / login (it's free).
QUESTION NO: 8
You have a Microsoft Excel 2016 workbook that has a Power Pivot model. The model contains the following tables:
* Product (Product_id, Producct_Name)
* Sales (Order_id, Order_Date, Product_id, Selasperson_id, Sales_Amount)
* Salesperson (Salesperson_id, Salesperson_name, address)
The model has the following relationships:
* Sales to Product
* Sales to Salesperson
You create a new Power BI file and import the Power Pivot model.
You need to ensure that you can generate a report that displays the count of products sold by each salesperson.
What should you do before you create the report?
You have a Microsoft Excel 2016 workbook that has a Power Pivot model. The model contains the following tables:
* Product (Product_id, Producct_Name)
* Sales (Order_id, Order_Date, Product_id, Selasperson_id, Sales_Amount)
* Salesperson (Salesperson_id, Salesperson_name, address)
The model has the following relationships:
* Sales to Product
* Sales to Salesperson
You create a new Power BI file and import the Power Pivot model.
You need to ensure that you can generate a report that displays the count of products sold by each salesperson.
What should you do before you create the report?
Correct Answer: C
Vote an answer
Explanation: Only visible for Actual4test members. You can sign-up / login (it's free).
QUESTION NO: 9
You have a table named Sales. A sample of the data in Sales is shown in the following table.
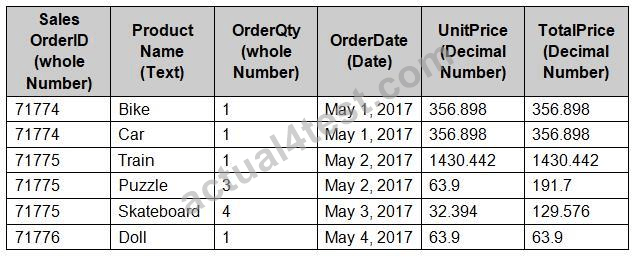
You created a stacked column chart visualization that displays ProductName by Date.
You discover that the axis for the visualization displays all the individual dates.
You need to ensure that the visualization displays ProductName by year and that you can drill down to see ProductName by week and day.
What should you do first?
You have a table named Sales. A sample of the data in Sales is shown in the following table.
You created a stacked column chart visualization that displays ProductName by Date.
You discover that the axis for the visualization displays all the individual dates.
You need to ensure that the visualization displays ProductName by year and that you can drill down to see ProductName by week and day.
What should you do first?
Correct Answer: A
Vote an answer
Explanation: Only visible for Actual4test members. You can sign-up / login (it's free).
QUESTION NO: 10
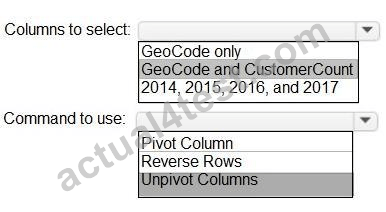
You have a query that uses a Microsoft Excel data source. The data source contains the following table.

You need the data to appear as shown in the following table.
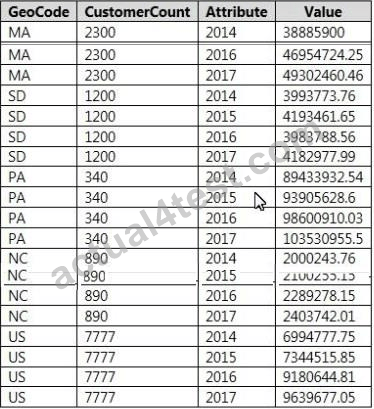
What should you do? To answer, select the appropriate options in the answer area.
NOTE: Each correct selection is worth one point.
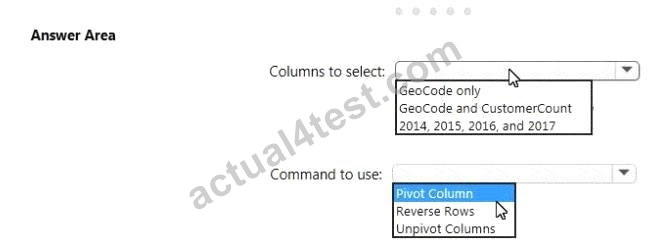
You have a query that uses a Microsoft Excel data source. The data source contains the following table.
You need the data to appear as shown in the following table.
What should you do? To answer, select the appropriate options in the answer area.
NOTE: Each correct selection is worth one point.
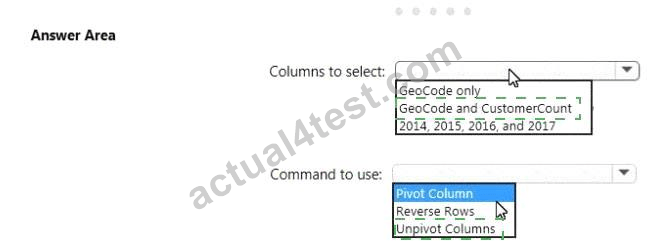
Correct Answer:
QUESTION NO: 11
You have a query named FactlnternetSales used by several Power BI reports. The query is shown in the exhibit. (Click the Exhibit button.)
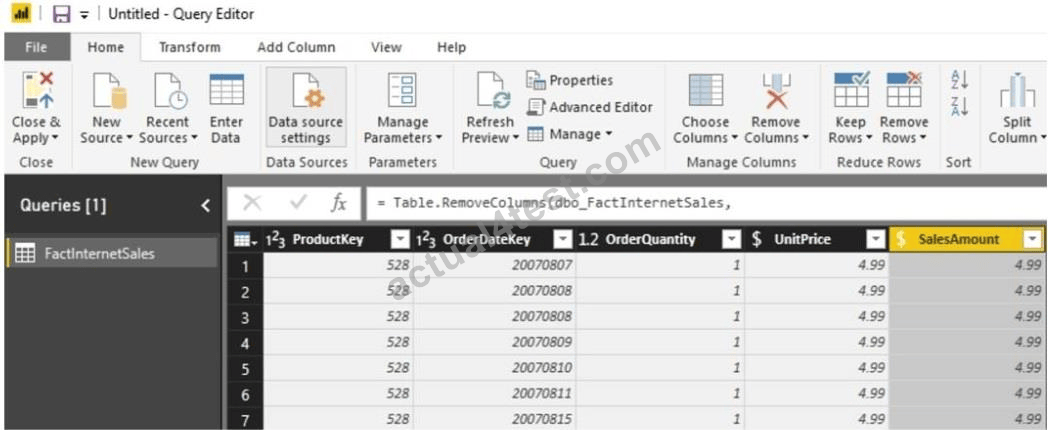
You plan to create a bar chart showing the count of sales by year that have a SalesAmount greater than $1,000.
You need to create a measure that will be used in the bar chart.
How should you complete the DAX formula? To answer, drag the appropriate values to the correct targets.
Each value may be used once more than once, or not at all. You may need to drag the split bar between panes or scroll to view content.
NOTE: Each correct selection is worth one point.

You have a query named FactlnternetSales used by several Power BI reports. The query is shown in the exhibit. (Click the Exhibit button.)
You plan to create a bar chart showing the count of sales by year that have a SalesAmount greater than $1,000.
You need to create a measure that will be used in the bar chart.
How should you complete the DAX formula? To answer, drag the appropriate values to the correct targets.
Each value may be used once more than once, or not at all. You may need to drag the split bar between panes or scroll to view content.
NOTE: Each correct selection is worth one point.
Correct Answer:

